Cell Venting Gas Mole Data for Pressure Simulation
The cell venting curve is the input that drives the whole event: it is what puts gas into the battery pack. This page covers both ways of supplying it.
Choosing a Data Source
Data Source switches between the two paths. Changing it clears whatever the other path had selected, so you never end up with an ambiguous setup.
| Mode | Use it when |
|---|---|
| Database | Learning the tool, or reproducing a tutorial |
| User Defined | Doing real work with your own measured curve |
Database Mode
Click Browse database… to open the picker. Each entry shows its model name, manufacturer, chemistry, format, capacity, total gas released, and venting duration, with a preview of the curve itself.
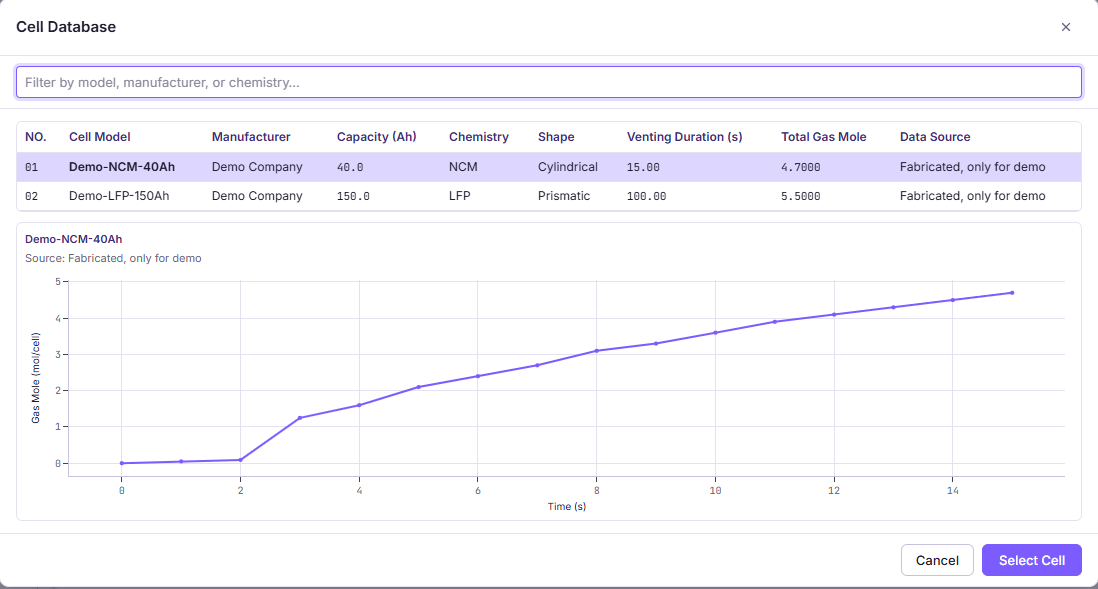
Select an entry and close the dialog. The line beneath the button confirms your choice. Your selection is remembered between visits.
The built-in entries are fabricated sample data and must not be used for design work. See Input Data Sources.
User Defined Mode
Selecting User Defined replaces the database picker with an upload control
for the Venting Gas Mole Curve.
File Format
A CSV file with a header row and at least two data rows. Two of its columns must be time and cumulative gas moles. Extra columns are allowed, since you choose which columns to use after uploading.
Time (s),Gas Mole (mol)
0,0
5,0.02
10,0.18
15,0.41
Mapping the Columns
After upload, the tool lists your headers and asks which column is which. It guesses from the header names, so a file with recognisable headings is usually mapped correctly on arrival. Check the guess before running, and set the time unit to seconds or minutes to match your file.
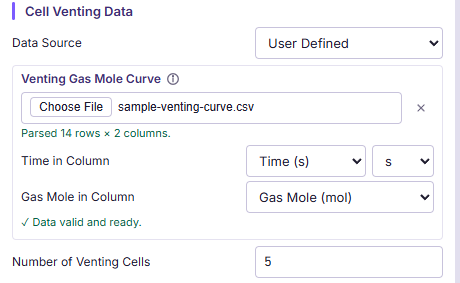
It confirms how many rows were accepted, and says Data valid and ready once
both columns are mapped and every rule below passes.
Validation Rules
The file is checked on upload and rejected with a specific message if any rule fails. The row numbers in error messages refer to lines in your file, counting the header as row 1.
| Rule | Applies to | Why |
|---|---|---|
| At least two columns, all headers unique | File | Columns are selected by name |
| Header row plus at least two data rows | File | Two points are the minimum for interpolation |
| Every cell is a finite number | File | No blanks, text, or NaN |
| Every row has as many values as the header | File | Catches ragged exports |
| File is 2 MB or smaller | File | |
| Strictly increasing | Time column | Time cannot repeat or go backwards |
| Starts at 0 or more | Time column | Negative time has no meaning here |
| Never decreasing | Gas mole column | The curve is cumulative, so it cannot fall |
| Starts at 0 or more | Gas mole column |
The most common rejection is a cumulative column that dips, usually from measurement noise around zero at the start. Clean it up before uploading rather than working around it, since a dip in a cumulative curve means a negative generation rate, which is not physical.
Cumulative, Not Rate
If your data is a generation rate in mol/s, integrate it before uploading. The tool expects the running total. The quickest check: your final value should equal the total gas that cell released, and the curve should never go down.
Number of Venting Cells
This multiplies the single cell curve, so ten cells produce ten times the gas at every instant.
Two points about what that means.
It assumes simultaneous venting. All cells follow the same curve starting at the same moment. Real propagation is sequential, so this is the conservative reading, which is the right one when you are demonstrating that an enclosure survives a stated number of cells. If you need the sequential case, build the combined curve externally with the delays included and upload it as a single cell curve with the count left at 1.
It is a scenario input, not a design knob. The number should come from your propagation test results or from the safety case you have to satisfy. Reducing it until the case passes changes the question rather than the answer.
Simulation Time Follows the Curve
When you select a database entry or upload a new file, the toolbar’s Simulation Time is set to the length of that venting curve plus 10 seconds. Once you type your own value there, the tool stops adjusting it, until you upload a different file.
The ten seconds matter. A valve reseats slightly after gas generation stops, not at the same instant, so a run that ended exactly with the curve would cut off the closing edge of the valve status trace every time, and would leave pressure part way down with no recovery visible. The tail covers the close and roughly nine seconds of decay.
Extend it further when you want to see the pressure recover after venting stops, which matters for spring valves, where the reclosing behaviour happens in the tail.