Reading the Results
A solve produces four headline numbers and four curves. This page explains all of them, and points out the two places people commonly misread the output.
The Verdict
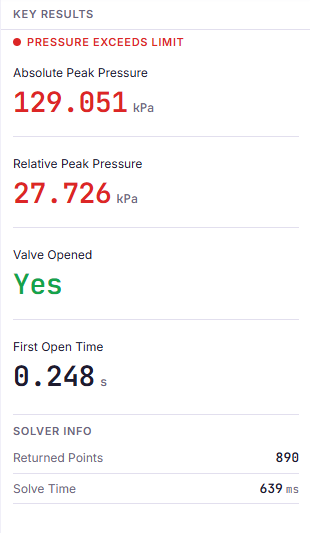
A strip at the top of the Key Results column reads either Pressure Within Limit or Pressure Exceeds Limit.
It compares the relative peak pressure against your Max Pressure Limit. Nothing else feeds into it. Since Max Pressure Limit is not a solver input, changing it flips the verdict without re-running anything.
The Four Metrics
| Metric | Meaning |
|---|---|
| Absolute Peak Pressure | Highest absolute pressure reached inside the pack, in kPa |
| Relative Peak Pressure | The same peak, measured from your ambient pressure |
| Valve Opened | Whether pressure ever crossed the valve’s opening threshold |
| First Open Time | When it first crossed, in seconds. Shown only if the valve opened |
Absolute or Relative
Both describe the same instant. The absolute value includes atmospheric pressure, the relative value does not.
Use the relative value for anything structural. Enclosure pressure ratings are quoted as a differential across the wall, because that is what loads the structure. The absolute value is useful mainly for sanity checking against measurements taken with an absolute sensor.
At sea level the two differ by about 101 kPa, which is far larger than a typical relative peak. Reading the absolute number as if it were relative will make every case look catastrophic.
Valve Opened Saying No
Not automatically good news. It means one of two things:
- pressure never reached the setpoint, so the valve was never needed. Check whether the relative peak is comfortably below the setpoint, in which case the venting load is genuinely mild.
- the case never developed. Check that the venting curve loaded correctly, that Number of Venting Cells is what you intended, and that Simulation Time covers the event.
If pressure exceeded your limit while the valve never opened, the setpoint is above your enclosure limit and this valve cannot protect this pack.
First Open Time
When the valve first crossed its threshold. Compare it against the shape of the venting curve. Opening very early means gas arrives faster than the closed valve can bleed it away, which is normal for a real event. Opening very late, close to the end of the simulation, often means the peak has not yet happened and the simulation window is too short.
Solver Info
Returned point count and solve time, below the metrics. Both are diagnostics about the run, not about your design. Neither carries engineering meaning, and both vary between identical runs.
The Four Charts
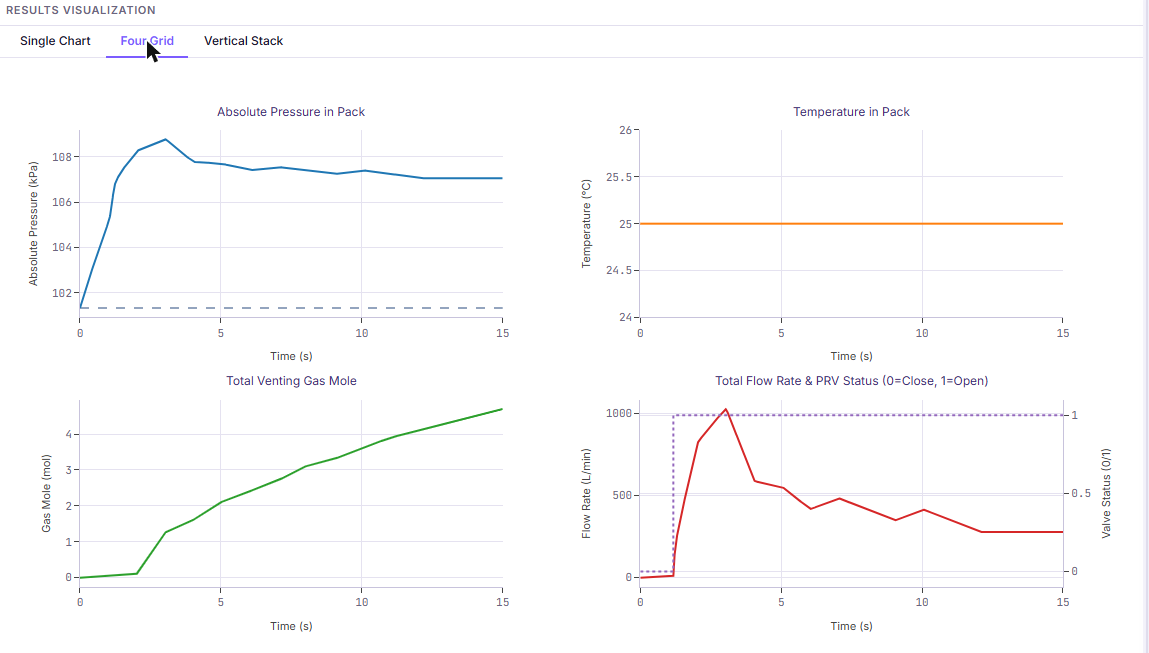
Available in three layouts: one at a time, in a two by two grid, or stacked on a shared time axis. Same data in all three.
Pressure
Absolute pack pressure against time, with a flat reference line at your ambient pressure. The shape tells the story: a rise while gas generation outpaces relief, a turnover at the moment they balance, and a decay as venting subsides.
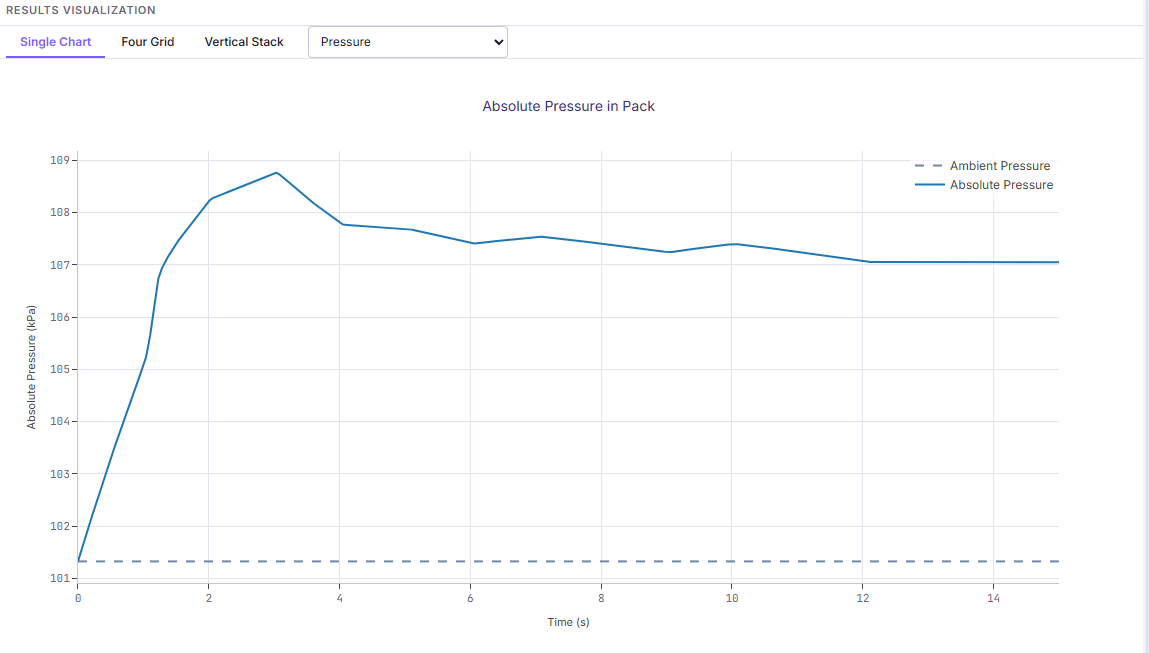
Read the turning point against the valve status trace. Pressure turning over shortly after the valve opens is what a correctly sized valve looks like.
Temperature
Gas temperature against time, in °C. Flat in Assumed Constant mode. This
chart exists mainly to confirm that an uploaded temperature curve was
interpreted as you expected.
Gas Mole
Cumulative moles released by the venting cells, which is your venting curve multiplied by Number of Venting Cells. It rises and then flattens when venting finishes.
Use it to confirm that the gas load is what you intended. Its final value should equal the total gas of one cell times the number of venting cells. If it does not, check the units on your uploaded curve.
This series is the gas released, not the gas still inside the pack, so it does not fall when the valve opens. To see relief happening, read the Valve Flow and Status chart instead.
Because Simulation Time runs past the end of the venting curve by default, the series holds its final value flat over that tail. Nothing more is released after the curve ends, and what was released does not go away.
Valve Flow and Status
Two series on one panel. Flow rate through the valve in L/min on the left axis, and valve status as 0 or 1 on the right axis.
Read the status trace first. A single step up means the valve opened once and stayed open. Several steps mean a spring valve reseated and reopened as pressure crossed back and forth over its thresholds, which is expected behaviour when gas arrives slowly. See PRV Behaviour.
Then look at flow. The jump when status goes to 1 is the switch from the closed flow curve to the open one, and its size tells you how much relief capacity the valve actually brought.
Chart Interaction
Drag to zoom into a region. Double click to reset. Hovering a chart reveals a toolbar for panning, autoscaling, and saving the chart as a PNG.
Why the Charts Have Fewer Points Than the CSV
Charts are drawn from a reduced set of points chosen to preserve the shape of the curves, so the browser stays responsive on long simulations. The CSV export is always full resolution.
Peak values reported in Key Results are computed from the full resolution result, not from the reduced set, so the number in the metric can be very slightly higher than the highest point you can hover on the chart. Trust the metric.
When Results Disappear
Editing any input that affects the physics clears the results and posts a warning in the Messages console. This prevents charts that no longer match the fields on screen. Max Pressure Limit and unit selectors are exempt, because neither changes the simulation.