Exporting Results
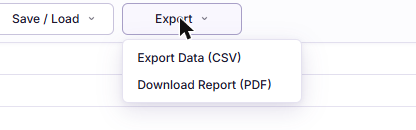
The Export menu becomes available once a solve has produced results. It offers two outputs for two different purposes.
| Export | Use it for |
|---|---|
| Export Data (CSV) | Post-processing, plotting elsewhere, comparing runs, archiving numbers |
| Download Report (PDF) | Design reviews, supplier conversations, project records |
Both are generated on demand, and each one counts against its own allowance. See Plans and Usage Limits.
CSV Export
Downloads as prv_results_<timestamp>.csv.
This is the full resolution result, every point the solver produced, not the reduced set drawn in the charts. On a long simulation the file can be considerably longer than the charts suggest.
Columns
| Column | Meaning | Unit |
|---|---|---|
Time_s | Time from the start of the simulation | s |
Pressure_kPa | Absolute pressure inside the pack | kPa |
Molar_Amount_mol | Cumulative gas released, all venting cells | mol |
Temperature_K | Gas temperature | K |
Temperature_C | The same temperature | °C |
Valve_Status | 0 when closed, 1 when open | |
Flow_Rate_m3s | Volumetric flow through all valves combined | m³/s |
Three notes that save time later.
Pressure is absolute. To get the relative pressure your enclosure limit is quoted against, subtract your ambient pressure.
Flow is in SI, not L/min. The charts display L/min because that is how valve datasheets are written. The CSV keeps m³/s. Multiply by 60000 to convert.
Temperature appears twice, in K and °C, so you do not have to convert for whichever convention your downstream tooling uses.
Reproducing the Reported Peak
Pressure_kPa at its maximum equals the Absolute Peak Pressure metric, because
both are computed from this same full resolution series. Subtracting your
ambient pressure from it gives the Relative Peak Pressure. If you are checking
the tool against your own post-processing, this is the comparison to make.
PDF Report
Downloads as prv_report_<timestamp>.pdf, and contains four sections.
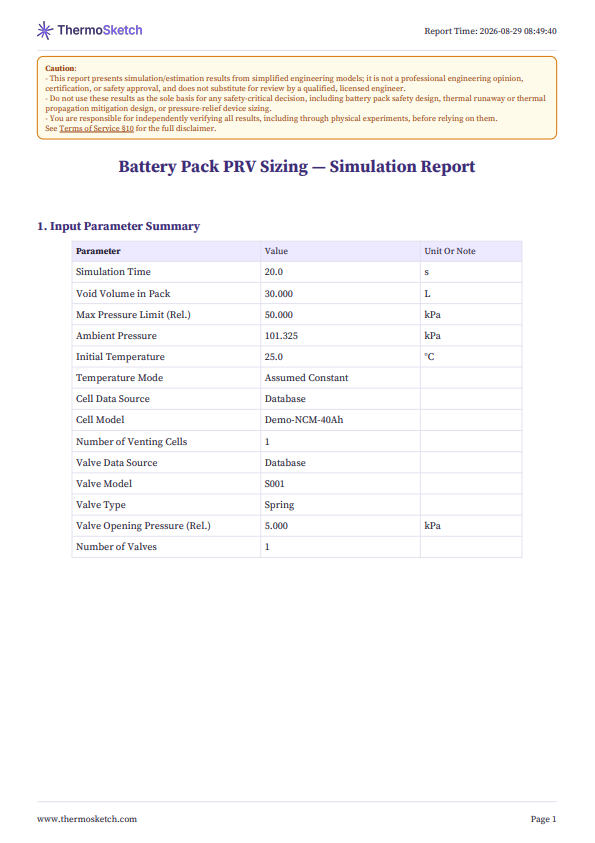
1. Input Parameter Summary. Every input as a table of parameter, value, and unit or note, including which database entries were used or whether the data was user supplied. This is what makes the report self-contained: a reader can reconstruct the case from the report alone.
2. Input Curves. The venting curve, both valve flow curves, and, if you supplied one, the temperature curve. Plotting the inputs alongside the results is how a reviewer catches a units error without having to ask for your files.
3. Simulation Results. The pressure, temperature, gas mole, and valve flow charts, followed by a combined chart with all series on shared axes.
4. Key Result Highlights. The metrics as a table of metric, value, and assessment. The assessment column is where your Max Pressure Limit appears, as the pass or fail judgement against the computed peak.
The report is generated from the same request that produced your on-screen results, so the two always agree.
Which One to Send
For a design review, send the PDF. It carries the inputs alongside the outputs, so nobody has to ask what the case was.
For anyone who will do their own analysis, send the CSV plus the saved configuration file. Between them they carry the full resolution numbers and an exactly reproducible setup. See Saving and Loading a Setup.
Timing and Failures
Exports run on our servers and take a few seconds. A progress indicator appears in the corner of the results column, and the Messages console logs the start and the outcome.
A failed export is recorded separately from a successful one, so a failure does not consume the allowance for work that produced nothing. If an export fails repeatedly, the error dialog offers to send us the exact setup that failed. See Troubleshooting.