The Workspace
The whole tool is one screen. Nothing is hidden behind navigation, and there are no projects or folders to manage. This page names every part of it.
The Toolbar
The toolbar runs across the top and holds everything that acts on the case as a whole.

| Control | What it does |
|---|---|
| Simulation Time (s) | How long to simulate, from 1 to 600 s. Set automatically to the venting curve length plus 10 s, until you edit it yourself |
| Run | Solves the case. Disabled, with a tooltip explaining why, until every required input is present |
| Save / Load | Downloads or restores a .json file holding all of your inputs |
| Export | Downloads results as CSV or as a PDF report. Disabled until a solve has produced results |
| Ask AI | Opens the assistant panel, on plans that include it |
| Feedback | Sends us a comment about the tool |
| Help | Opens this documentation |
| Avatar | Account menu: profile, usage, billing, sign out |
Why Run Is Sometimes Disabled
Hover the button and the tooltip names the missing piece. There are only a few possibilities, all of them about inputs the solver cannot proceed without:
- the built-in databases are still loading, or failed to load
- no cell has been selected from the database
- no valve has been selected from the database
- a required CSV has not been uploaded, or did not parse
Each is covered in Troubleshooting.
The Three Columns
Input Parameters (Left)
Everything that describes the case, in four groups: Battery Pack Geometry, Working Conditions, Cell Venting Data, and Pressure Relief Valve Characteristic. Fields with an information icon beside the label carry a short explanation, including the expected format for every CSV upload.
Drag the divider on its right edge to resize the column. Click the divider, without dragging, to collapse the column entirely and give the charts the full width. Click again to bring it back. The tool remembers both the width and the collapsed state.
Results Visualization (Centre)
Three tabs, all showing the same solved data in different arrangements:
| Tab | Layout |
|---|---|
| Single Chart | One quantity, chosen from the dropdown beside the tabs: Pressure, Temperature, Gas Mole, or Valve Flow and Status |
| Four Grid | All four in a two by two grid |
| Vertical Stack | All four stacked on a shared time axis |
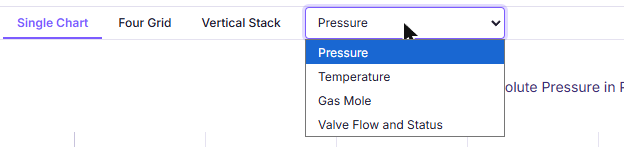
The tabs are disabled until a solve produces results.
Every chart is interactive. Drag to zoom into a region, double click to reset, and use the toolbar that appears when you hover over a chart to pan, autoscale, or save the chart as a PNG.
Charts are drawn from a reduced set of points, chosen to preserve the shape of the curve, so the browser stays responsive. If you need every point the solver produced, export the CSV, which is always full resolution. See Exporting Results.
Key Results (Right)
The verdict strip at the top says Pressure Within Limit or Pressure Exceeds Limit, comparing the relative peak pressure against your Max Pressure Limit.
Below it are the four headline metrics, and below those a Solver Info block
with the returned point count and the solve time.
Full explanations of every metric are in Reading the Results.
The Messages Console
Underneath the charts, collapsible, with a count badge. It logs every significant event with a timestamp: database loading, solves starting and finishing, exports, warnings, and errors. Newest entries appear at the bottom.

When something does not behave as you expect, read this first. It usually already says why.
How Results Go Stale
Change any input that affects the physics and the tool clears the results and
posts Input parameters changed. Please run simulation again. in the console.
This is deliberate. Charts that no longer correspond to the fields on screen
are worse than no charts at all.
Two fields are exempt, because they do not change the simulation:
- Max Pressure Limit, which only moves the pass or fail threshold
- unit selectors, which only change how a value is displayed
Loading a saved configuration also clears results, without the warning, since you asked for a wholesale change.
Re-running an Unchanged Case
If you press Run when results are already on screen and nothing has changed, the tool asks you to confirm. Since results are only kept while the inputs that produced them are untouched, an unchanged case would return an identical answer and spend another run from your quota. Confirming proceeds anyway.
Leaving the Page
Inputs and results live in the browser tab and nowhere else. If you try to close or reload the tab with unsaved results on screen, the browser asks you to confirm. There is no server copy to recover, by design. See Saving and Loading a Setup.