Input Parameters
This page is the field by field reference. It follows the order the fields appear on screen, top to bottom.
The final column answers a question worth asking about every input: does this change the physics, or only the presentation?
Toolbar
| Field | Meaning | Units | Range | Default | Affects the simulation |
|---|---|---|---|---|---|
| Simulation Time | How long to simulate, from the start of venting | s | 1 to 600 | Venting curve length plus 10 s | Yes |
Simulation Time is filled in for you from the duration of the selected venting curve plus 10 seconds, and it updates whenever you change the cell selection. The extra ten seconds are there so the run does not stop at the instant gas generation does, which would hide the valve closing and the pressure recovery. Once you type a value yourself, the tool stops overriding it, until you load a different cell data file.
Choose it to cover the whole event, including the tail after the peak. Cutting the simulation short before pressure has turned over can hide the peak entirely.
Battery Pack Geometry
| Field | Meaning | Units | Range | Default | Affects the simulation |
|---|---|---|---|---|---|
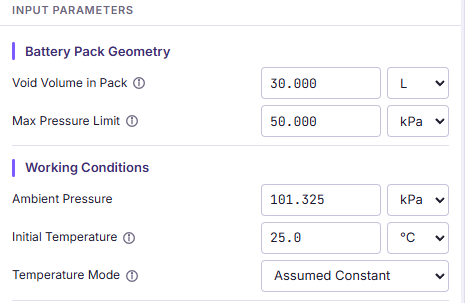
| Void Volume in Pack | Free gas volume inside the sealed enclosure | L, m³, in³, ft³ | Greater than 0, up to 10 m³ | 30 L | Yes |
| Max Pressure Limit | Pressure your enclosure can withstand, relative to ambient | kPa, Pa, bar, psi | 0 or more | 50 kPa | No |
Void Volume in Pack is the gas space, not the enclosure’s outer volume. Subtract cells, modules, cooling plates, busbars, potting, and every other solid. Pressure rise is inversely proportional to this number, so an overestimate makes the case look better than it is.
Max Pressure Limit is not a solver input at all. It is the threshold your result is compared against, and it only drives two things: the pass or fail verdict in the Key Results column, and the assessment column in the PDF report. Changing it does not invalidate your results and does not require a re-run, which is why it is the one field that never triggers the stale results warning.
Its value should come from your enclosure structural analysis or a burst test, expressed as a differential across the wall.
Working Conditions
| Field | Meaning | Units | Range | Default | Affects the simulation |
|---|---|---|---|---|---|
| Ambient Pressure | Pressure outside the pack | kPa, Pa, bar, psi | 50 to 200 kPa | 101.325 kPa | Yes |
| Initial Temperature | Gas temperature inside the pack at t = 0 | °C, K, °F | -40 to 1000 °C | 25 °C | Yes |
| Temperature Mode | Constant temperature, or a supplied curve | Assumed Constant, Given Test Data | Assumed Constant | Yes | |
| Temperature Curve | Uploaded temperature against time | Appears only in Given Test Data mode | Yes |
Ambient Pressure sets the reference the valve’s differential pressure is measured against, and it is the floor the model does not let pack pressure fall below. If you are working at altitude, set it accordingly, since a lower ambient means the same absolute pack pressure represents a larger differential across the enclosure wall.
Initial Temperature is greyed out in Given Test Data mode, because the
uploaded curve supplies the temperature instead.
See Temperature Modes for how to choose between the two modes.
Cell Venting Data
| Field | Meaning | Units | Range | Default | Affects the simulation |
|---|---|---|---|---|---|
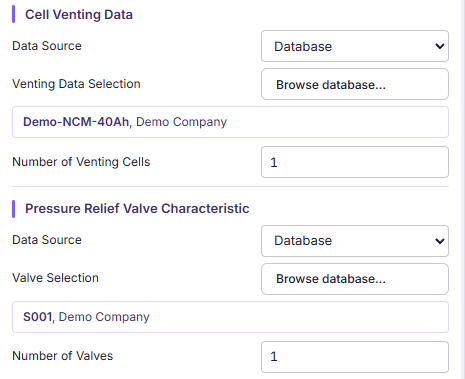
| Data Source | Built-in entry, or your own file | Database, User Defined | Database | Yes | |
| Venting Data Selection | Which built-in entry | Database mode only | Yes | ||
| Venting Gas Mole Curve | Your uploaded curve | s or min, mol | User Defined mode only | Yes | |
| Number of Venting Cells | How many cells vent in the scenario | 1 to 500, whole numbers | 1 | Yes |
Number of Venting Cells multiplies the single cell curve. It is a scenario choice, not something to reduce until the case passes. See Cell Venting Data.
Pressure Relief Valve Characteristic
| Field | Meaning | Units | Range | Default | Affects the simulation |
|---|---|---|---|---|---|
| Data Source | Built-in entry, or your own file | Database, User Defined | Database | Yes | |
| Valve Selection | Which built-in entry | Database mode only | Yes | ||
| P–Q Curve Before Opening | Flow while the valve is closed | Pressure in kPa, Pa, bar, psi. Flow in L/min, m³/s, m³/h, CFM | User Defined mode only | Yes | |
| P–Q Curve After Opening | Flow once the valve has opened | same as above | User Defined mode only | Yes | |
| Valve Type | Whether the valve can reclose | Spring, Membrane | Spring | Yes | |
| Opening Pressure | Setpoint, relative to ambient | kPa, Pa, bar, psi | 0.5 to 50 kPa | 5 kPa | Yes |
| Number of Valves | How many identical valves are fitted | 1 to 50, whole numbers | 1 | Yes |
Opening Pressure appears only in User Defined mode, because a database entry carries its own. It records the setpoint from your supplier datasheet. See Valve Characteristic.
Two Fields People Misread
Worth stating plainly, because both cost people a confused half hour.
Max Pressure Limit does not change the answer. If you raise it, the pressure curve does not move. Only the verdict does.
Simulation Time is not a convergence setting. Extending it does not make the result more accurate. It only decides how much of the event you see. If the pressure curve is still climbing at the right-hand edge of your chart, extend it. Otherwise leave it where the tool put it.
Unit Handling
Every unit selector converts on entry. The value you type is interpreted in the unit shown beside it, converted internally, and converted back for display if you switch units afterwards. Switching a unit never changes the physical value, and never invalidates your results.
The solver itself works in SI throughout. If you are reproducing a result by hand, work in Pa, m³, K, mol, and m³/s. See Mathematical Model.